Collaborative project · Giovanna Calabrese Villanueva & Ana Campos
2,420skincare products
3models compared
0.62best test R²
The question
Which skincare products deserve more attention?
In a beauty marketing scenario, the challenge is to identify products worth investigating for campaigns and merchandising tests. I used product favorites as a signal of consumer interest, then asked which product characteristics help explain that interest.
This is an independent portfolio analysis using a public dataset, not work commissioned by Sephora.
The data
2,420 products. One signal of interest.
The product_info.csv file contains 8,494 products and 27 fields. Filtering to skincare produced 2,420 products, 11 selected fields, and 143 brands. Each row represents one product; the target is loves_count, the number of product favorites.
There were 69 missing ratings and 69 missing review counts, no duplicate rows or product IDs, and no invalid prices or counts. High-price devices and highly favorited products were inspected and retained.
The approach
Prepare carefully. Compare fairly.
Split products into 1,936 training and 484 test records (80/20, random_state=42).
Impute missing ratings and review counts using training-set medians only. Fit one-hot encoding on training brands and categories; handle unseen categories without refitting.
Convert eight predictors into 155 columns. Exclude product identifiers from modeling. VIF values were below 5.
Compare Linear Regression, Decision Tree, and Random Forest on the same test set.
The evidence
Attention is unevenly distributed.
A few products pull the mean favorites count to 27,111, compared with a median of 10,074. Lip Balms & Treatments leads category medians at 26,121 favorites across 61 products; Moisturizers has 8,788 across 551 products.
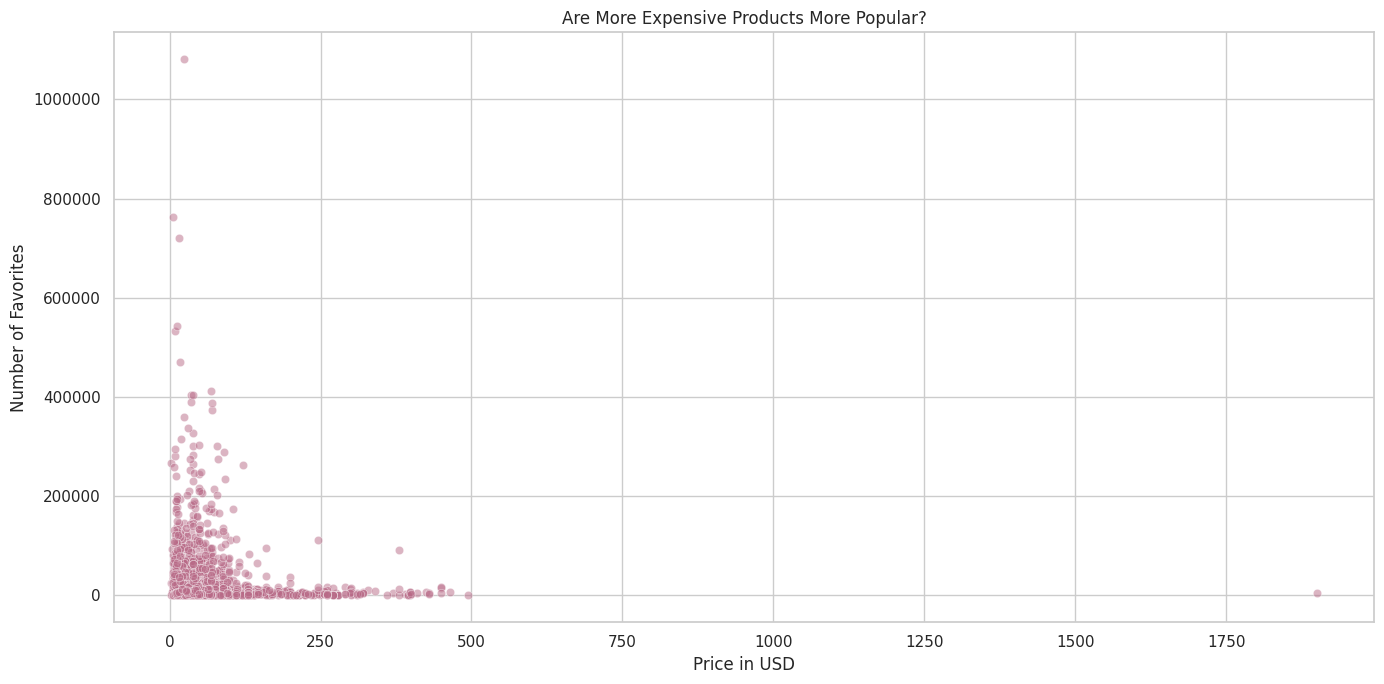
Original notebook chart · Product price and favorites. The full dataset includes a $1,900 beauty device.
Review count has the strongest positive linear association with favorites (r = 0.72). Price (r ≈ −0.11) and rating (r = 0.01) provide little guidance on their own.
Model
Test R²
Test RMSE
Test MAE
Random Forest
0.62
24,300
12,464
Linear Regression
0.56
25,928
16,111
Decision Tree
0.53
26,722
14,474
Errors are in number of favorites; lower RMSE and MAE are better. The Random Forest performs best among the three tested models. Its all-predictor R² is 0.615 when shown to three decimals.
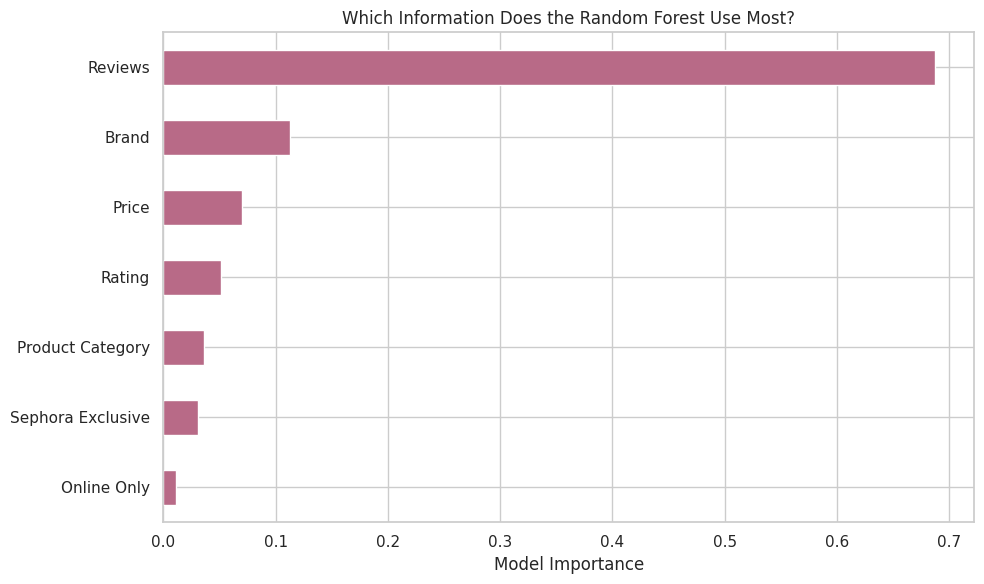
Original notebook chart · Grouped feature importance for the reduced Random Forest. Importance is predictive, not causal.
The business recommendation
Test the opportunity. Measure the purchase.
Investigate lip care products for a small visibility or campaign test, checking stock and suitability first. Combine category context, brand, and customer activity rather than choosing products on price or rating alone.
Compare the test with the current shopping experience and measure purchase conversion and revenue. These are proposed next steps: the project does not establish sales lift or measured campaign impact.
What I would improve
Interest is not a transaction.
Favorites are not purchases. Product age and exposure could influence both reviews and favorites.
An average absolute error of about 12,464 favorites is substantial relative to the overall median of 10,074. Use estimates cautiously.
Removing limited_edition barely changed the result: R² remained 0.615, with MAE increasing from 12,464.281 to 12,468.488. This choice reused the test set; confirm it with independent validation.
Feature importance can favor continuous variables and groups with many categories. Add product launch dates, exposure, and sales before stronger commercial conclusions.
The business narrative comes from the supplied presentation; model setup and results were cross-checked against the supplied notebook and its saved outputs. Presentation downloads are optimized visual copies. Original data files are required to rerun the analyses.
Data: Kaggle Sephora Products and Skincare Reviews, product_info.csv. Random Forest: 200 trees, minimum leaf size 5. Decision Tree: maximum depth 6, minimum leaf size 10. Both use random_state=42. SQL and dashboard findings are documented in the supplied presentation and notebook narrative; a separate SQL source file was not supplied.